
This bar chart compares foot width (in mm) across different foot lengths (in mm) for three regions. Each bar represents the average foot width for a given foot length in a specific region.
Across all three regions, as foot length increases, foot width also increases. This is expected since larger feet generally have wider proportions. Asia (AS) has the widest feet for all foot lengths. Europe (EU) is in the middle, with foot width values slightly lower than Asia. North America (NA) has the narrowest feet, with consistently lower values compared to both AS and EU. The difference in foot width between the regions remains fairly consistent across foot lengths. There are no sudden spikes or irregularities, indicating that the trend is uniform across different foot sizes.
Asian markets require wider shoes to accommodate the broader foot width. North American designs should focus on narrower fits, ensuring shoes provide a snug fit. European shoes should maintain a balanced width range to cater to an intermediate foot shape. Shoe brands targeting multiple markets should offer regional variations in shoe width rather than a one-size-fits-all approach. Brands could introduce multiple width options (e.g., standard, wide, extra-wide) tailored for each market. Would you like a comparison against the raw data values from the table?
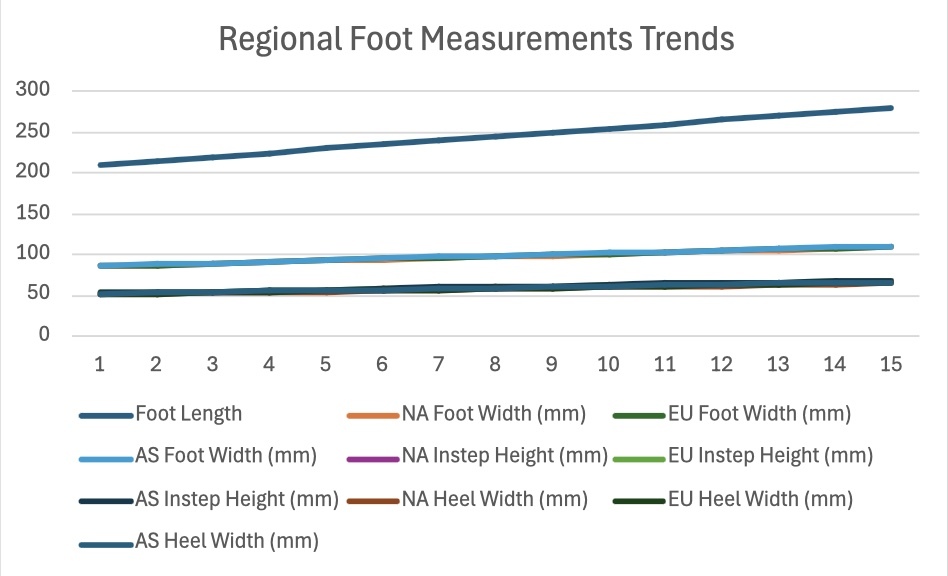
This line chart presents various foot measurements (length, width, instep height, and heel width) across different regions: North America (NA), Europe (EU), and Asia (AS). The x-axis represents foot sizes or measurement intervals, while the y-axis shows the measurement values in millimeters.
The most prominent trend is that foot length (represented by the top-most line) increases linearly across all regions. This indicates a consistent correlation between foot length and other dimensions like width and instep height. Asian (AS) foot width remains the highest, followed by European (EU) and then North American (NA). This suggests that people in Asia generally have wider feet than those in Europe and North America, reinforcing the need for region-specific shoe designs.
Instep height (the vertical measurement of the top of the foot) follows a similar pattern, with AS having the highest values, followed by EU, and NA with the lowest. Heel width differences are less pronounced but still follow the same regional ranking. The steady increase across all foot dimensions suggests proportional scaling as foot size increases, meaning manufacturers can predict changes in width, instep height, and heel width based on foot length.Asian footwear should offer wider toe boxes and higher insteps to accommodate naturally broader feet. North American footwear may benefit from narrower, more fitted designs, ensuring proper foot support. European shoe designs should aim for a middle ground, balancing between wide and narrow options. Shoe brands should develop multiple width variations for each foot length to serve a global audience effectively.
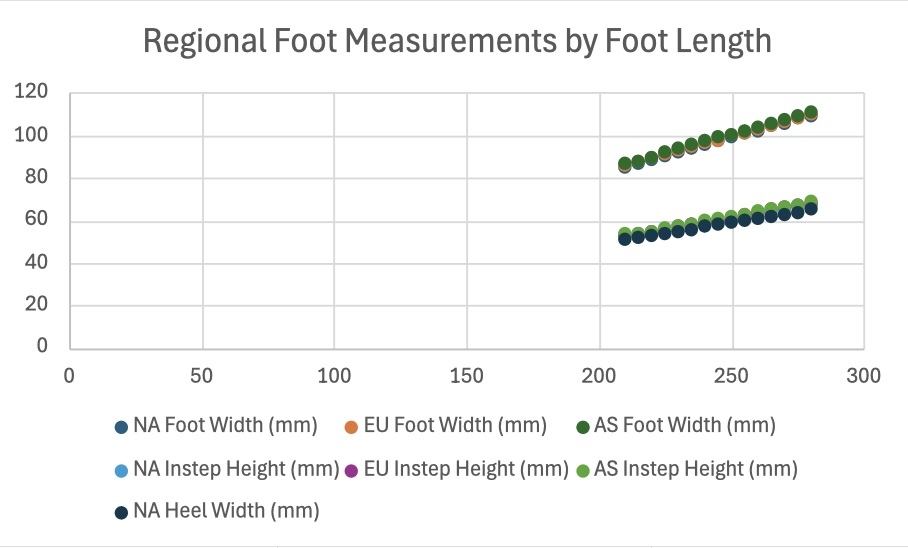
This scatter plot displays various foot measurements (width, instep height, and heel width) against foot length. Each region (NA, EU, AS) is represented with different color-coded dots. The x-axis represents foot length (mm), while the y-axis represents the corresponding foot dimension values (mm).
As foot length increases, foot width also increases proportionally across all regions. This confirms that individuals with longer feet also tend to have wider feet, reinforcing the need for proportional shoe width adjustments. The scatter points for AS foot width are consistently positioned higher than EU and NA, confirming that Asian feet are broader. NA foot measurements tend to cluster toward the lower end, indicating narrower feet overall. These two measurements remain relatively stable with smaller variations, but AS measurements tend to be slightly higher than EU and NA. This suggests that instep height differences across regions are less dramatic than foot width differences, though still relevant for comfort in shoe design.
Foot width should be a primary factor in regional shoe design. The noticeable differences across regions mean that standard widths won’t fit all consumers properly. Instep height and heel width adjustments should be considered, but they may require less drastic modifications than foot width. Shoe manufacturers should incorporate width grading strategies—offering multiple width options per size to accommodate varying foot structures.
| Foot Length | NA Foot Width (mm) | EU Foot Width (mm) | AS Foot Width (mm) | NA Instep Height (mm) | EU Instep Height (mm) | AS Instep Height (mm) | NA Heel Width (mm) | EU Heel Width (mm) | AS Heel Width (mm) |
|---|---|---|---|---|---|---|---|---|---|
| 210 | 85.5 | 86 | 86.5 | 52.5 | 53 | 53.5 | 51 | 51.5 | 52 |
| 215 | 87 | 87.5 | 88 | 53 | 53.5 | 54 | 52 | 52.5 | 53 |
| 220 | 89 | 89.5 | 90 | 54 | 54.5 | 55 | 53 | 53.5 | 54 |
| 225 | 90.5 | 91 | 92 | 55 | 55.5 | 56.5 | 54 | 54.5 | 55.5 |
| 230 | 92.5 | 93 | 94 | 56 | 57 | 57.5 | 55 | 55.5 | 56.5 |
| 235 | 94 | 95 | 96 | 57.5 | 58 | 58.5 | 56 | 56.5 | 57.5 |
| 240 | 96 | 96.5 | 97.5 | 58.5 | 59 | 60 | 57 | 57.5 | 58.5 |
| 245 | 97.5 | 98 | 99 | 59.5 | 60 | 61 | 58 | 58.5 | 59.5 |
| 250 | 99 | 100 | 100.5 | 60.5 | 61 | 62 | 59 | 59 | 60.5 |
| 255 | 101 | 101.5 | 102.5 | 61.5 | 62.5 | 63 | 60 | 60 | 61.5 |
| 260 | 102.5 | 103 | 104 | 62.5 | 63.5 | 64.5 | 61 | 61 | 62.5 |
| 265 | 104.5 | 105 | 106 | 64 | 65 | 65.5 | 62 | 62 | 63.5 |
| 270 | 106 | 106.5 | 107.5 | 65 | 66 | 66.5 | 63 | 63 | 64.5 |
| 275 | 108 | 108 | 109 | 66 | 67 | 67.5 | 64 | 64 | 65.5 |
| 280 | 109.5 | 110 | 111 | 67 | 68 | 69 | 65 | 65 | 66.5 |